

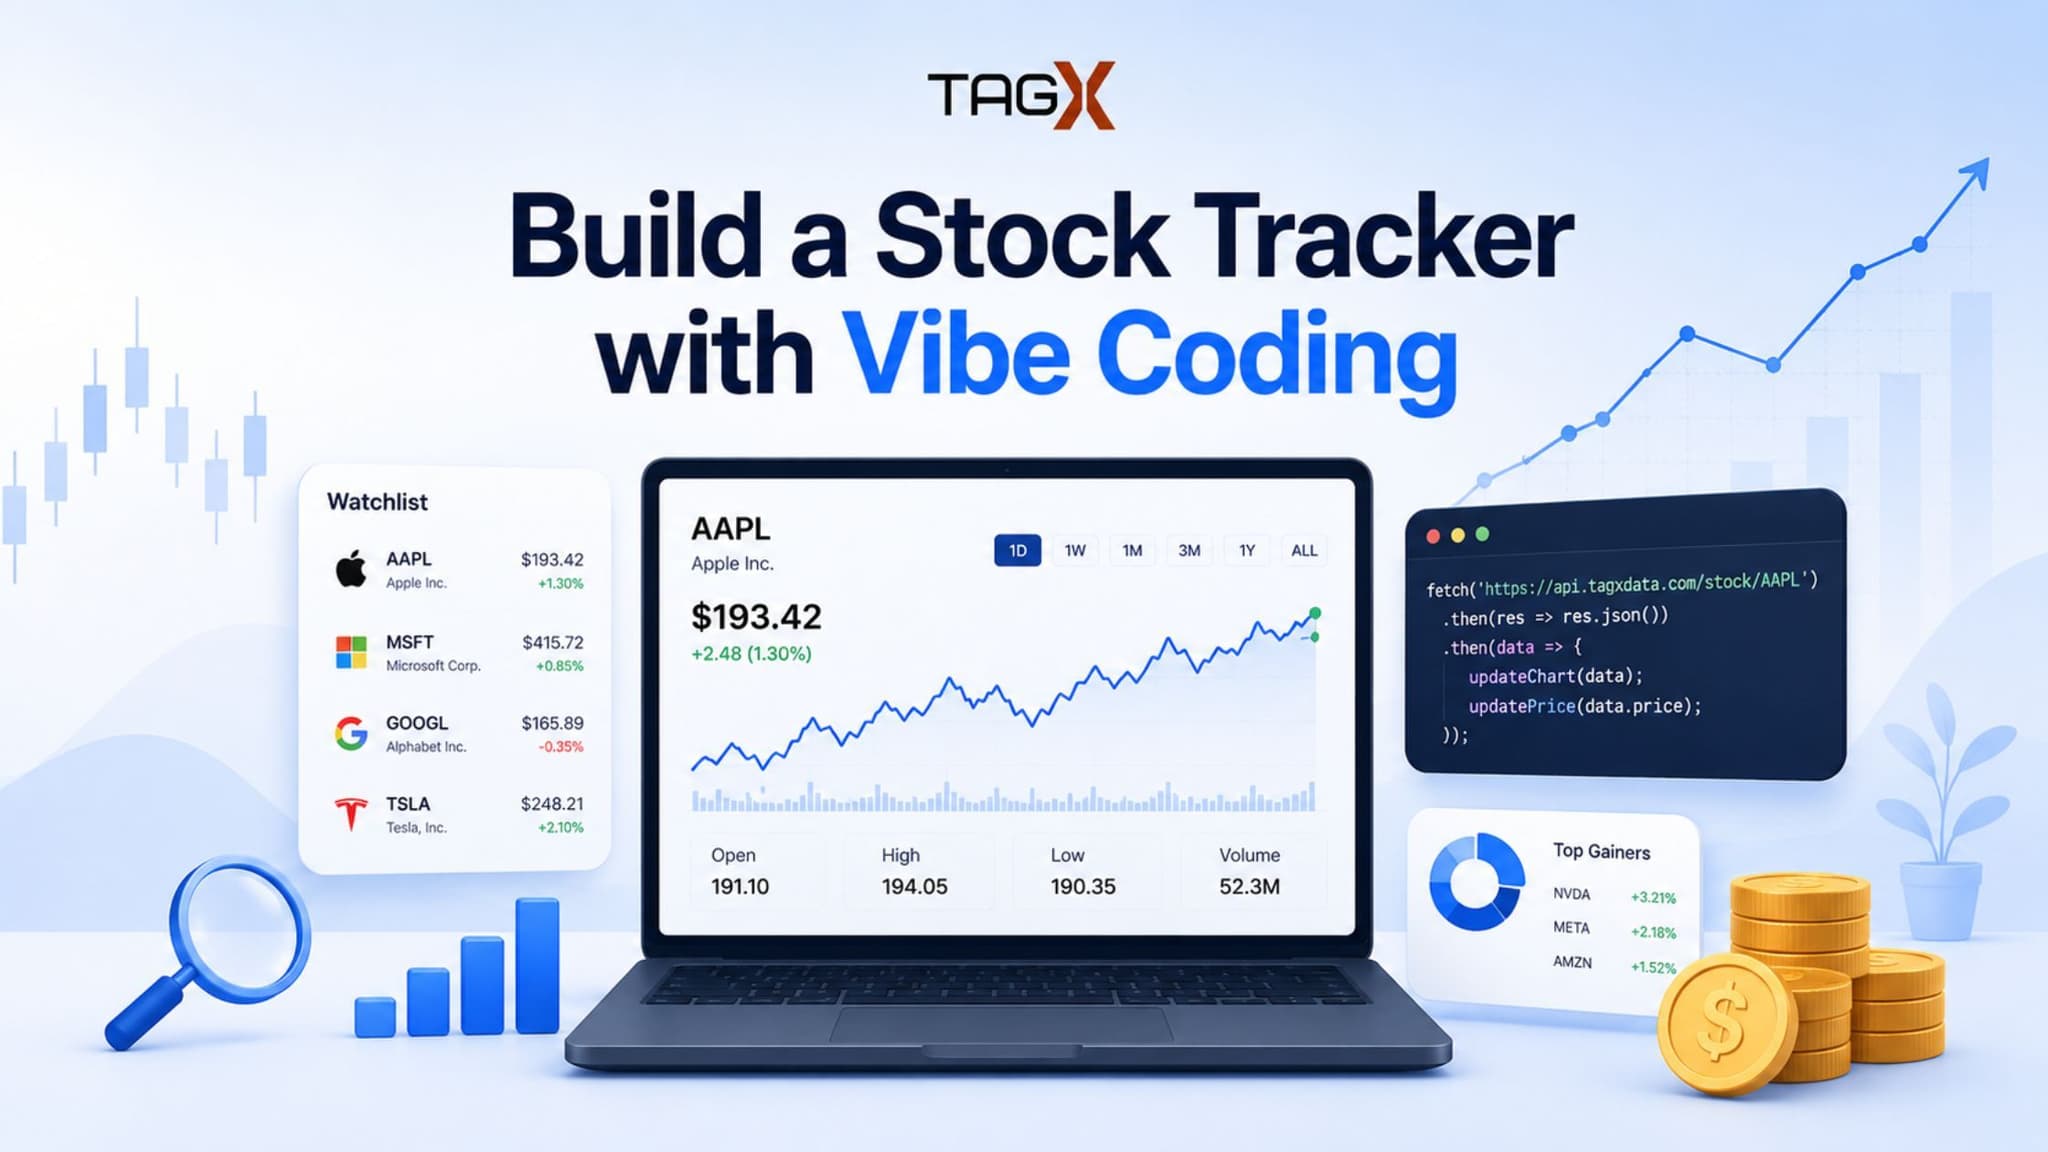
You want a stock tracker that actually shows your own watchlist, your own numbers, not another generic dashboard. The good news: you don't need to be a full-stack engineer to build one anymore. With an AI coding assistant handling the implementation and a solid market data API handling the numbers, you can go from idea to working app in a weekend.
This is a build-along guide. We'll "vibe code" the app — describing what we want to an AI assistant like Claude Code or Cursor and iterating on what it produces — while using TagX's Finance API as the backend data source for real stock prices. By the end, you'll have a working watchlist app with live prices, gain/loss tracking, and historical charts.
Why Stock Tracking Apps Are Harder Than They Look
The UI part — a list of tickers, a few numbers, a chart — is the easy part. Any AI coding assistant can scaffold that in minutes. The part that actually breaks most side projects is the data.
Stock prices aren't sitting in a neat file waiting for you. You need a source that's current, covers the tickers your users actually care about, and doesn't fall over the moment you make more than a handful of requests. A lot of people start by scraping a finance website, hit a wall the first time the site changes its layout, then bounce between three different free APIs trying to find one with decent coverage. That's usually where the "weekend project" turns into a "why did I start this" project.
This is exactly the problem a dedicated market data API is meant to solve, so it's worth picking one early instead of retrofitting it later.
There's also a decision most people don't think about until it bites them: real-time data feeds are expensive and often overkill for a personal project. What you actually want early on is delayed or end-of-day data that's accurate and consistently formatted, with the option to upgrade to real-time later if the project grows. Picking a source that offers both from day one saves you a painful migration down the line.
What You Need Before You Start
- An AI coding assistant — Claude Code, Cursor, or similar, comfortable with full-stack prompts
- A TagX API key — sign up at finance.tagxdata.com and grab a key from the free trial tier; that's enough to build and test everything in this guide
- A stack you're comfortable with — this guide assumes a simple setup: a Node/Express or Python/FastAPI backend, and a React frontend, but the pattern holds for any stack
- A code editor and Node/Python installed locally
- About 2–4 hours, depending on how far you take the extras
Step 1: Plan the App With Your AI Assistant
Before writing a single line of code, spend five minutes prompting your assistant to help you plan. This is the actual "vibe coding" part — you're not specifying implementation details, you're describing outcomes.
A reasonable planning prompt looks like:
"I want to build a personal stock tracker. Users can add tickers to a watchlist, see current price and daily change, add a portfolio with quantity and purchase price to track gain/loss, and view a price history chart per stock. Backend will call the TagX finance API for data. Suggest a file structure and data model for a React frontend and Node/Express backend."
Let the assistant propose a structure, then adjust. You'll typically end up with something like:
- /backend — Express server, routes for stock data, .env for the TagX API key
- /frontend — React app, components for Watchlist, StockCard, PortfolioSummary, PriceChart
- A simple data model: { ticker, quantity, purchasePrice, addedAt } stored locally or in a lightweight database like SQLite
Don't over-plan here. Vibe coding works best when you treat the plan as a rough draft you'll correct as you go, not a spec you have to get perfect upfront.
Step 2: Connect TagX as Your Data Backend
This is the step that determines whether the rest of the app is easy or painful, so it's worth doing properly.
TagX's API is a straightforward REST interface — you send a ticker, you get back structured JSON with price, volume, and company data.
A basic call looks like this:
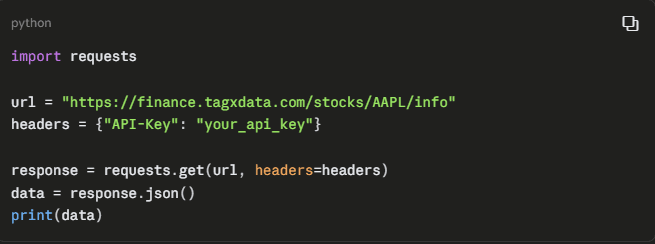
Ask your AI assistant to wrap this in a backend route, something like /api/stock/:ticker, so your frontend never talks to TagX directly and your API key stays server-side:
"Create an Express route /api/stock/:ticker that calls the TagX finance API for that ticker's info and returns the price, daily change, and company name as JSON. Read the API key from an environment variable."
Why route it through TagX instead of stitching together free sources yourself? Here's the practical comparison:
| DIY / scraping / free APIs | TagX Finance API | |
|---|---|---|
| Data format | Inconsistent across sources, needs custom parsing per source | Single structured JSON schema across 30,000+ tickers |
| Coverage | Usually US-only, gaps in ETFs/funds | US, Europe, APAC, and other global exchanges |
| Historical data | Often missing corporate action adjustments (splits, dividends) | Adjusted historical OHLCV data included |
| Reliability | Scraped sites break when layouts change | Stable REST endpoints built for this purpose |
| Getting started cost | Free, but hours of glue code and debugging | Free trial tier to test before committing to a paid plan |
The point isn't that free sources are unusable — it's that for a project where you want to spend your time on the app, not on data plumbing, having one reliable endpoint that returns clean JSON for both current and historical data removes an entire category of debugging.
Step 3: Build the Watchlist and Portfolio UI
With the backend route working, move to the frontend. Prompt in small, testable chunks rather than asking for the whole UI at once — you'll get better results and it's easier to course-correct.
A good sequence:
"Build a Watchlist component that lets a user add a ticker by typing it in, calls /api/stock/:ticker, and displays the current price and daily change."
"Add a delete button to remove a ticker from the watchlist."
"Add a PortfolioSummary component where each watchlist item can optionally have a quantity and purchase price, and show unrealized gain/loss in dollars and percent."
Run the app after each prompt. If something looks off — wrong color for negative change, layout breaking on smaller screens — describe the visual problem directly ("the loss numbers should be red, gains green, and the cards should stack on mobile") rather than trying to fix CSS by hand. This is where vibe coding actually saves time: small, specific corrections instead of digging through component code yourself.
Step 4: Add Historical Charts
A watchlist with just current prices is useful, but a trend line is what makes it feel like a real tool. TagX's historical endpoints return OHLCV data, which is exactly what a charting library needs.
Prompt your assistant:
"Add a route /api/stock/:ticker/history that fetches historical daily prices from TagX for the last 30 days. Build a PriceChart component using a charting library that plots closing price over time when a user clicks a stock in the watchlist."
This is a good moment to also decide how far back you want data (7 days, 30 days, 1 year) and whether you want intraday granularity — TagX supports multiple intervals, so you can let your assistant wire up a simple dropdown to switch between them if you want that flexibility.
Step 5: Handle the Edge Cases
This is the step people skip, and it's the one that makes a demo feel like a real app. A few prompts worth running before you call it done:
- "What happens if a user types an invalid ticker? Add error handling that shows a friendly message instead of a broken card."
- "Add a loading state for the stock cards while the API call is in flight."
- "Cache stock data for 60 seconds on the backend so repeated requests for the same ticker don't hit the API unnecessarily."
- "Handle the case where the TagX API returns a rate limit error, and show a retry option."
None of these are hard to implement, but they're easy to forget when you're moving fast, and they're exactly the kind of thing an AI assistant handles well when you ask directly.
Step 6: Deploy It
Once it works locally, get it in front of yourself on a phone or share it with someone:
- Frontend: Vercel or Netlify — connect your GitHub repo, it deploys on push
- Backend: Render or Railway for the Express/FastAPI server
- Environment variables: set your TagX API key in the hosting platform's dashboard, never commit it to the repo
- Quick sanity check: test with a handful of tickers across different exchanges to confirm the data holds up outside your local setup.
Where to Take It Next
Once the core tracker works, the natural extensions are price alerts (poll TagX on a schedule and notify on threshold moves), support for other asset types like ETFs and mutual funds, and basic auth so you can use it as a real personal tool instead of a local-only project. None of these require rethinking the architecture — you're just prompting your assistant to extend what's already working.
The bigger takeaway: the hard part of a project like this was never the UI. It's having a data source you can build on top of without constantly patching around its gaps. Get that piece right early, and the rest of the app comes together fast — vibe coding or not.
If you're weighing whether to build this at all, the honest answer is that a weekend is a realistic estimate once you take data sourcing off your plate. Most of the time you'd otherwise spend debugging a scraper or reconciling three different API formats goes instead into things that actually make the app feel like yours — the layout, the metrics you care about, which tickers show up first. That's a better use of a weekend, and it's the difference between a project you finish and one that sits half-built in a repo.